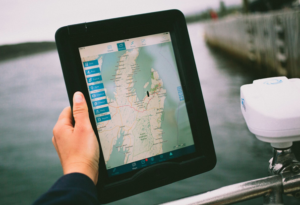
Saltwater Fishing with the mazu SportFishing App – The Power of Satellite Communication:
When it comes to offshore fishing, it is no secret that there are a number of factors that can improve or hinder the success of a day on the water. Offshore fishing, especially for big game fish, is not an endeavor that one simply gets right on their first attempt. Mastering the craft of offshore fishing can take a lifetime, and even the most experienced angler can have off days or streaks of poor luck. Considering just how challenging offshore fishing can be, it is important to have access to every available tool and trick that can maximize your chance for a successful fishing trip. That’s where having the latest satellite imagery on your side can prove invaluable.
Learning how to interpret and utilize satellite imagery and data is not a complex task. However, the importance of using satellite imagery cannot be overstated. Many anglers make the mistake of sticking to previous fishing “hot spots” or areas they feel comfortable in, but this may not always lead to fishing success. Ocean conditions can change rapidly, and satellite imagery can help point anglers in the right direction, ultimately saving on fuel, time, and frustration.
mazu SportFishing ensures anglers can remain connected and receive the latest satellite imagery while still being affordable. With a host of weather options and sea state data available on request, mazu SportFishing allows anglers to enhance their offshore fishing experience and fish smarter. This article will cover some of the features of mazu SportFishing and the importance of satellite imagery for offshore fishing, including:
- Sea surface temperature.
- Chlorophyll charts.
- Ocean currents.
- Ocean structure.
Sea Surface Temperature – Understanding Fish Preferences:
For anglers who have experience with fishing offshore, it won’t come as a surprise to hear that fish such as yellowfin tuna, wahoo, or billfish prefer different water temperatures and conditions. However, water temperature can fluctuate quite significantly in both warmer waters and even more so in temperate regions such as the Mid-Atlantic. Considering this variability in temperature, being able to track changes in water temperature is the first step to utilizing satellite imagery to improve your offshore fishing results.
The same location an angler has had success with might not always remain the same in terms of temperature, and fishing in an area that your target fish prefers is critical. Beginning your day by requesting SST maps for your fishing area of choice is a surefire way to get on the right track towards catching more fish.
If you’re wondering what temperature range your preferred fish enjoys, this fishing temperature breakdown chart from SaltWater Sportsman can help get you started:
It should also be noted that using SST maps can be an even more important practice during the beginning or end of a fishing season. Early or late season temperatures can determine when your target fish will begin to inhabit certain geographic regions, so plan accordingly!
With mazu SportFishing, overlaying a SST map is simple and user-friendly. Simply select Sea State from the options at the top menu, and select either cloud-free or HD SST imagery depending on current weather conditions.

Seamlessly overlay SST maps with mazu SportFishing
You can download entire sections of SST data when connected over the internet, or select 30 or 60 nautical mile sections for download. There are two benefits to downloading 30 or 60 nautical mile sections of sea surface temperature data. Firstly, smaller SST maps are smaller in file size, and by only updating smaller sections when offshore, mazu SportFishing allows anglers to remain connected while cutting down on data usage and cost.
However, the greatest advantage of downloading smaller SST sections is the increase in SST definition. Larger SST maps can help anglers identify general areas that might have a temperature break, but smaller SST sections can highlight the finer differences in sea surface temperature to provide a more definite indication of a temperature break.


The above images are the same SST section, with the second image having a 30 nautical mile high-res SST map overlaid on top of the original map. The additional detailed provided by the 30 nautical mile can help anglers find a temperature break before setting out from shore, ultimately saving on time and fuel and increasing fishing success.
Chlorophyll Charts – Phytoplankton and Water Clarity:
Once you have referenced a SST map to find the general regions your target fish is more likely to inhabit, you can use chlorophyll data to help optimize your fishing route. Chlorophyll satellite imagery can help you determine where phytoplankton concentrations are and where water clarity varies.
Phytoplankton are self-feeding oceanic organisms that play a critical role in ocean ecosystems and the production of oxygen on earth. Phytoplankton also contain chlorophyll inside their cells, and when present in large numbers, phytoplankton blooms may become noticeable, marked by a distinct green water coloring. Identifying these blooms with satellite imagery can also help anglers find the right areas to fish.

Phytoplankton are a primary food source for many baitfish, and concentrations of phytoplankton therefore serve as a reliable indicator that baitfish are nearby. Since pelagics feed on baitfish, phytoplankton blooms can also lead to the presence of large pelagics that are attracted by the high numbers of baitfish. Blooms that have been present for several days are also excellent to identify when preparing for a fishing trip as lengthy bloom periods will allow the food-chain to fully develop.
So why does water color matter? Pelagics generally prefer clearer, blue water, whereas baitfish will be attracted by the opportunity to feed in a green, murkier phytoplankton bloom. The distinction between green and blue water is referred to as a color break, and the boundary between colors can have the perfect combination of baitfish and pelagic fish to offer ideal fishing conditions.
You may have heard other anglers mention fishing a temperature break, or you may already be familiar with fishing color breaks. The truth is that temperature breaks and color breaks are usually correlated; if you find a temperature break, chances are you’ll find a color break nearby (and vice versa). In this sense, it doesn’t always matter if you set out seeking either a temperature break or color break. So long as you understand the temperature range your target fish prefers and can find where that temperature range also corresponds to a color break, you’ll have a higher chance of catching more of your target fish.
With mazu SportFishing, the process for overlaying a chlorophyll chart is the same as with SST maps. Simply select chlorophyll from the Sea State options, and select a region to request chlorophyll data.
Ocean Currents – The Relationship Between Currents, Sea Surface Temperature, and Chlorophyll:
If you’ve come this far and are prepared to use both SST maps and chlorophyll charts to enhance your offshore fishing experience, you’ve already greatly increased the likelihood of having a successful fishing venture. If you’re looking for additional information and data that could take your offshore fishing experience even further, analyzing ocean currents is your best friend.
Whether you’re fishing in warm, cool, green, or blue water, ocean currents will always have an impact on fish and their behavior (not to mention your own boat and lines/bait). Major systems such as the Gulf Stream carry warmer water into normally cooler regions (in this case from the Gulf of Mexico into the mid-Atlantic and coast of New England). These diverging water temperatures can promote a temperature break, which as we learned above, strongly correlates with the presence of phytoplankton blooms and a color break. Why do currents impact phytoplankton? Currents can lead to upwellings from deep ocean water, which is nutrient rich and also promotes the growth of phytoplankton and other organisms baitfish prey on.

Keeping the importance of ocean currents in mind while offshore is another critical aspect that can help ensure a successful fishing excursion. By fishing along current edges where pools and eddies can form, anglers can more easily identify temperature breaks and find fish faster. Understanding the importance of current flow can also be important when fishing around structures or rips.
mazu SportFishing allows anglers to request sea surface height, current velocity, and current height data. Be sure to use these reports to understand the major currents impacting your fishing location and how to optimally fish in your environment.
Ocean Structure – How to Fish a Rip and Understanding Fish Behaviour:
Realizing how ocean structure impacts the behavior of fish is another key aspect of improving your offshore fishing skillset. Locating regions with ideal sea temperatures and color breaks is the first step to using satellite data to help locate game fish, but ocean structures can be just as important.
Ocean structures such as canyons, reefs, or ledges can provide baitfish a perfect habitat to seek protection while feeding, and this in turn can attract gamefish. Bottom ocean structures can also create rips, as changes in ocean depth can alter current speed and cause the current to be deflected towards the surface and ripple. The up-current side of a rip is smooth, and accelerates over ocean structures before gradually turning into rough water as it drops off on the down-current side. Game fish often wait on the down-current side of ocean structures, ready to ambush their prey as they accelerate over the edge of ocean structures.
An excellent image courtesy of www.onthewater.com shows a technique that anglers can use to optimally fish a rip. Trolling parallel to a rip on the up-current side can allow your bait to be dragged through the rip while keeping your boat a safe enough distance away from ocean structures or the fast moving current. Alternatively, you can also troll with the current as gamefish tend to face into the current while waiting for prey to pass by.

mazu SportFishing users have complete access to NOAA charts that display ocean depth and ocean topography. Download and overlay NOAA charts before requesting sea surface temperature data to display ocean temperatures overtop of ocean topographic information. Be sure to download NOAA charts for free while connected to the internet and effectively plan your route before heading offshore. Saved NOAA charts will be located in your downloads and can be viewed at any time.


The Takeaway – Using SST, Chlorophyll, and Satellite Communication for Fishing:
Ultimately, using satellite data and imagery does not have to be a complicated task. When broken down into the fundamentals, there’s really 3 steps to using satellite imagery to catch more fish:
- Using SST maps, locate a region where the water temperature is ideal for your target fish.
- Match the ideal temperature range with a color break (these are usually correlated and color breaks are visible out on the water so you can identify this easily).
- Use ocean currents and structure to your advantage. Fish edges and rips and know the areas that baitfish like to hide.
By planning a route at home with satellite imagery, anglers can ultimately save both time and on fuel by eliminating guesswork and heading to an area that is more likely to yield results. Satellite imagery won’t physically put a fish on the end of your line, but it could mean the difference between returning home empty-handed and catching your target fish.
Interested in mazu SportFishing? Head over to the iPad App Store to download the app today! You can also learn more about mazu SportFishing at www.mazu-marine.com/sportfishing. If you know a fellow angler who is struggling with their offshore fishing results, be sure to share this article and pass on the knowledge of using satellite imagery when fishing offshore.


One Comment
Peter Bradson
It is very impressive saltwater fishing tips for us such a new angler. Lot’s of thanks for sharing.